
22 May 2020
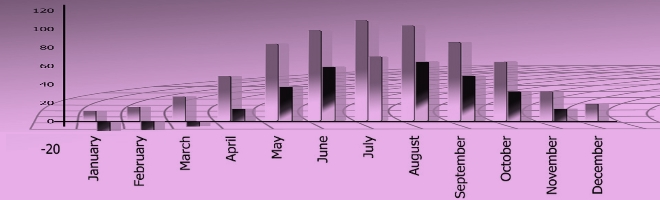
– Unemployment Claimant Flows as an Indicator of Economic Performance
This article compares alternative claimant count flows and the alternative claimant count flows as a percentage of working population, with the top 10 and worst 10 performing authorities idenitified.
– Alternative claimant count flows (February 2020)
This is a spreadsheet that when opened, enables you to select your local authority to compared figures against other local authorities and rural averages for alternative claimant count flows.
– Alternative claimant count as percentage of working population (December 19)
This is a spreadsheet that when opened, enables you to select your local authority to compared figures against other local authorities and rural averages for alternative claimant count as a percentage of working population.