T: 01822 851370 E: [email protected]
27.08.2014
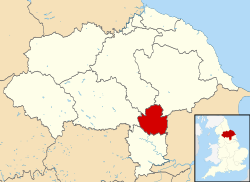
City of York
|
Working for our part of Rural England with the Rural Services Network |
|
|
Location: Yorkshire and the Humber Population: 208,400 (2016) Interesting fact: The International Ghost Research Foundation announced in 2002 that York is officially the most haunted city in Europe.
|
||||
| City of York |
City of York is a member of the Rural Services Network and falls |
||||
City of York Information |
||
| Phone number 01904 551550 |
Website www.york.gov.uk |
Local Enterprise Partnerships (LEPs) Leeds City Region, York and North Yorkshire |
| Frequency of elections Elections are of whole council |
Number of councillors 47 |
Political composition Labour - 15 Conservative - 14 Lib Dem - 12 Green - 4 Independent - 2 |
| MPs York Central - Rachael Maskell (Labour (Co-op)) York Outer - Julian Sturdy (Conservative) |
Decision making structure Leader and a Cabinet |
Population change Population change One Year Population Change + 1.2% Ten Year Population Change + 9.9% |
| Police Authority North Yorkshire Police Authority |
Fire Service North Yorkshire Fire and Rescue Service |
Health Authority NHS Yorkshire & the Humber |
| Area 27,200 Hectares |
Rural Output Areas 104 rural OAs from 637 OAs in total |
Audited by Northern Region (Audit Commission) |
| Rural Classification (Defra) Urban with City and Town |
Population by Area- (Density) 7.61 people per hectare |
Number of Parishes 31 |
| Number of Parish Meetings 0 |
Number of Parish Councils 30 |
Number of Town Councils 1 |
| Average house price £213,000 (Median price paid by local authority, year ending Q4-2015 - provided by UK HPI data published by Land Registry © Crown copyright 2016) |
Outsourced Services Information yet to be supplied |
Average age of population 39.5 (2011 Census data) |
| Main Towns / Cities Haxby, York |
Unemployment rate 0.4% (JSA claimants for August 2017) |
Current Council Tax (amount reported is the amount received by the Council - no other services are included) 2014/2015 Council Tax - £1,165.54 2015/2016 Council Tax - £1,165.54 2016/2017 Council Tax - £1,177.20 2017/2018 Council Tax - £1,244.93 |
| Percentage of households socially rented from council or local authority 8.8% (2011 Census data) |
Percentage of population who have reported they are in very good health 49.7% (2011 Census data) |
Percentage of population which provides unpaid care 9.2% (2011 Census data) |
| Employment by Occupation Percentage of people aged 16 and over who are in Social Major Group 1-3 47.9% (ONS annual population survey - April 15-March 16) |
Average annual wage for full time employees
|
Percentage of those employed in full time employment 38.1% (2011 Census data) |
| Cars or vans owned per household (2011 Census data) No cars or vans - 26.1% 1 car or van - 46.7% 2 cars or vans - 22.2% 3 cars or vans - 3.8% 4 or more cars and vans - 1.2% |
Local Newspapers Information yet to be supplied |
National Park/AONBs None |
2015 English Indices of Deprivation analysis tool
(Produced by Oxfordshire County Council) |
||

(All factual information on these pages is updated annually by the RSN)
(Information given via links will however be updated as new information becomes available)


