T: 01822 851370 E: [email protected]
Visit RSN Survey about life in rural England to find out more.
Spotlight on the RSN Observatory

The RSN's Observatory is the place to discover the statistics behind key issues facing rural communities in England, issues that the RSN is striving to highlight and tackle through its work. The Observatory is additionally a great place to understand the numbers that define the communities within our membership through an expanding group of analyses, with this body of work soon to be given its own area on the RSN website called Member Insights.
Keep checking the 'What's New' section of the RSN's weekly Rural Bulletin to discover the latest RSN analyses and Observatory work.
In this edition of the 'Spotlight on the RSN Observatory', Dan Worth, our Research and Performance Analyst explores the latest National Travel Survey and the picture it paints for travel in rural areas of England. The full RSN analysis can be found at:
https://www.rsnonline.org.uk/national-travel-survey
and the source data can be found at:
https://www.gov.uk/government/collections/national-travel-survey-statistics
What is the NTS?
The National Travel Survey (NTS) is a household survey designed to monitor long-term trends in personal travel and to inform the development of policy. It is the primary source of data on personal travel patterns by residents of England within Great Britain.
The survey collects information on how, why, when and where people travel as well as factors affecting travel (e.g. car availability and driving licence holding).
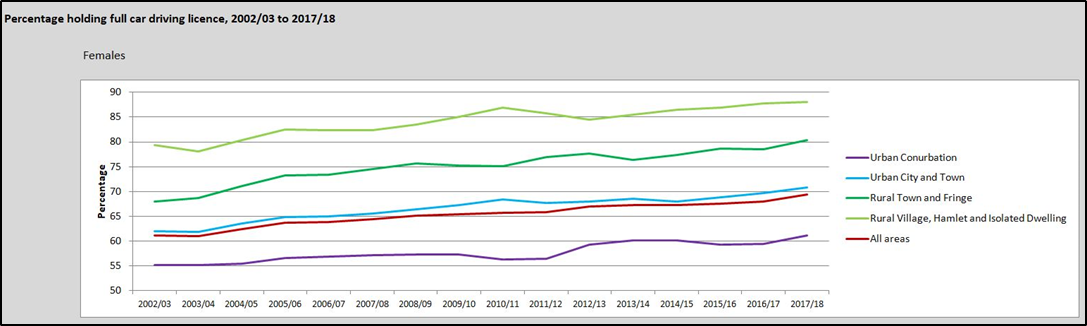
Percentage holding full car driving licence
In the period between 2002/03 to 2017/18 the proportion of men living in rural villages, hamlets and isolated dwellings who hold a full car driving licence has remained stable at between 90% to 95%. Likewise the proportion for men living in rural town and fringe has been relatively stable at between 85% and 90%. Conversely the proportion of females in this period holding a full car driving licence has increased from around 80% to 88% for those in rural villages, hamlets and isolated dwellings, and from just under 70% to 80% for those in rural towns and fringe areas. For both female and male residents alike, the proportion of people holding a full car driving licence is greater in rural areas than urban, which to a certain degree demonstrates the importance of driving for those people living in rural areas. The difference between the proportions of male and female driving licence holders might highlight an increase likelihood of possible isolation within the female rural community.
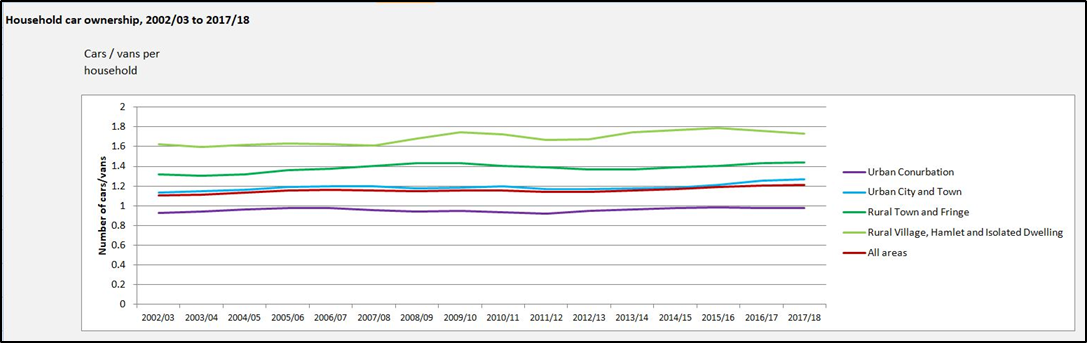
Household car ownership
The number of cars or vans owned per household reflects the situation for driving licences in that households in rural areas have more cars/vans per household than households in urban areas. The more rural the household, the more cars/vans the household is likely to have. This again supports the supposition that residents in rural areas rely more heavily on vehicle ownership.
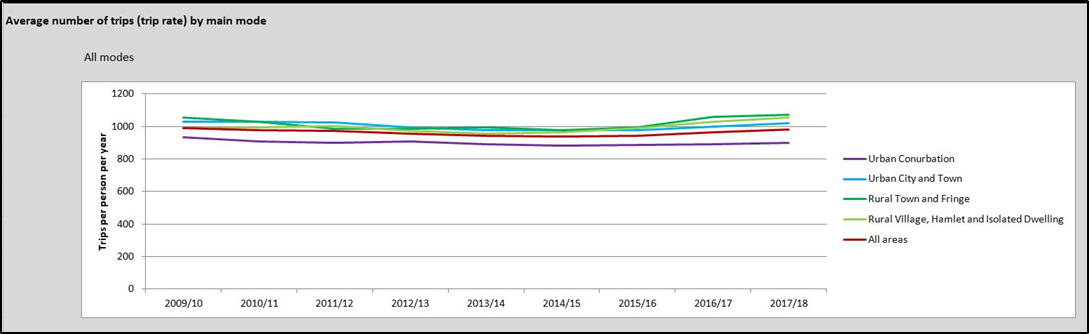
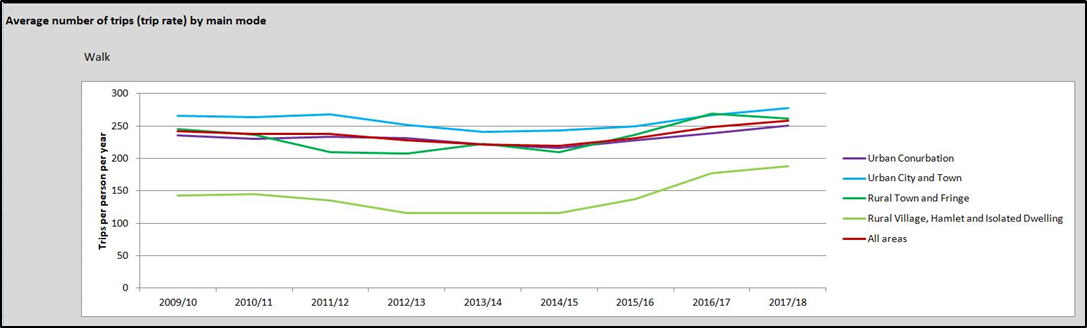
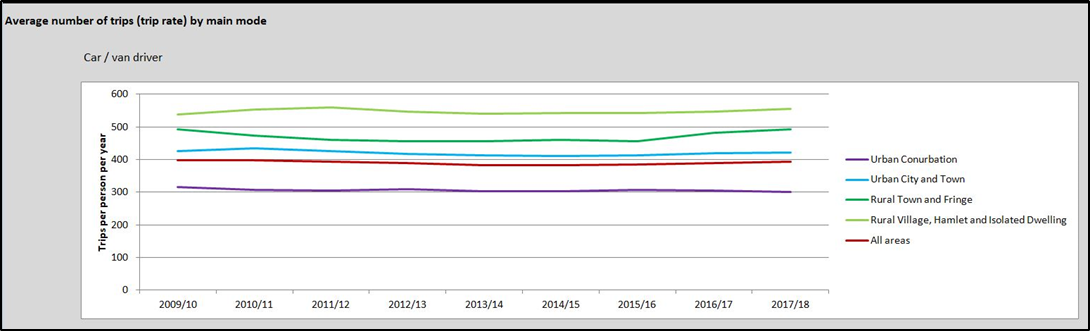
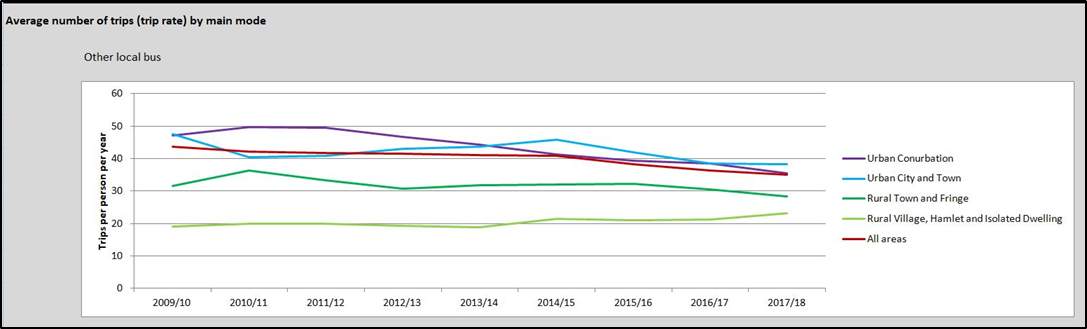
Average number of trips
The average number of trips over all modes of transport is roughly similar and stable whether you live in a rural or urban household. Rural being slightly higher.
In the most rural of households, walking is generally not a realistic proposition when going out. This is evident in consistently much lower number of trips made by this mode.
As you move from the most urban to the most rural households, so the number of trips made as a car or van driver increase also.
However, almost the opposite is true when you consider the use of 'Other local bus' since bus services simply are not available or not suitable when travelling from the most rural of households. It is only when a density of housing supports regular, convenient bus services that using a bus for transport becomes realistically possible.
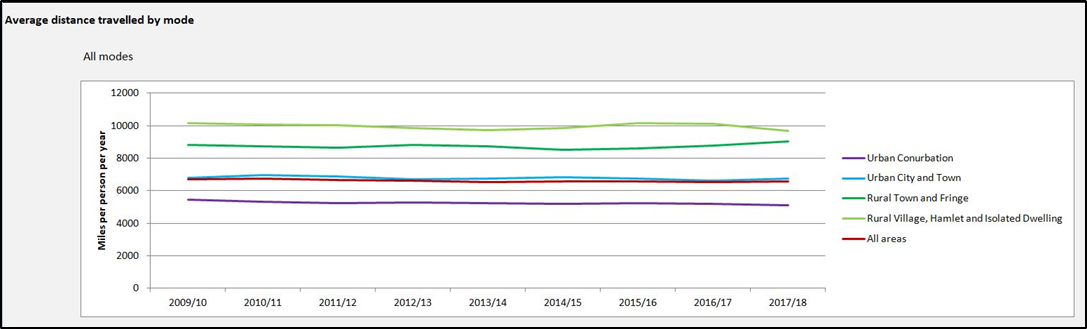
Average distance travelled
When considering the average distance travelled over a year, the situation has remained relatively static since 2009/10 for all households. Unsurprisingly the households in the most rural locations travelled the furthest in a year, and the least rural travelled least far. The distances travelled for households in either rural or urban locations go some way to explaining the mix of transport options that are adopted in either a rural or urban situation.
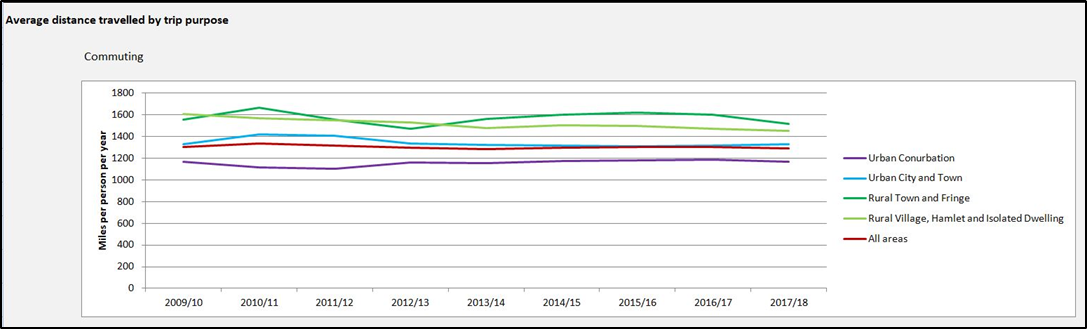
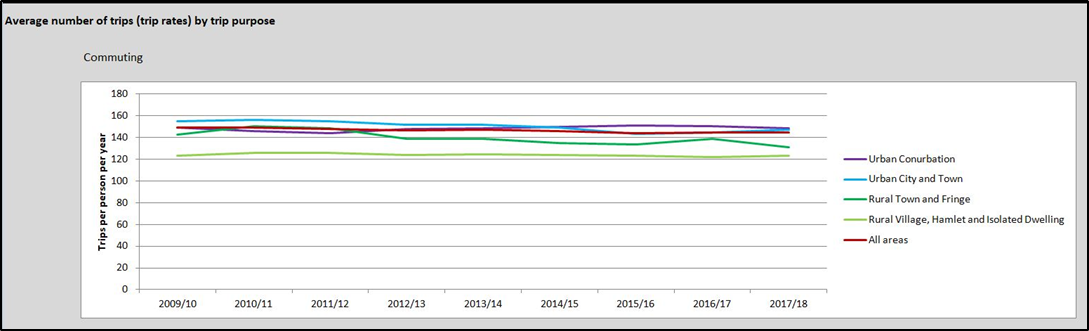
Distance travelled and number of trips for commuting
Increasing household rurality results in a greater distance travelled in a year for commuting purposes. The distance is the result of conversely a lower number of trips in a year for the purpose of commuting. This might be explained by increased home working and business owners basing themselves at home in rural households.
School travel
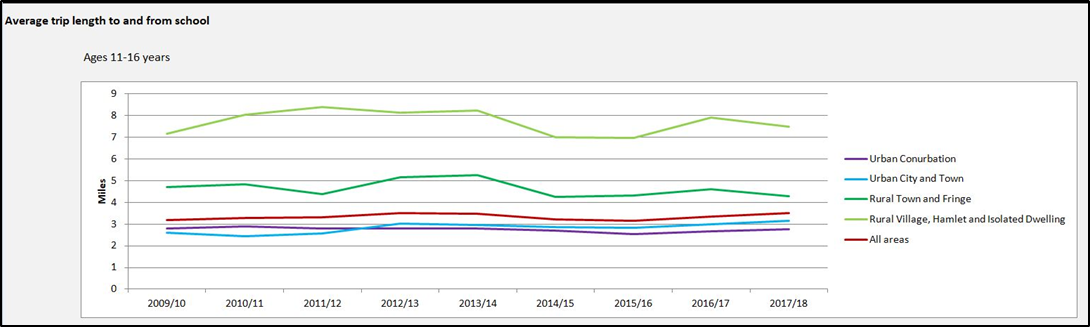
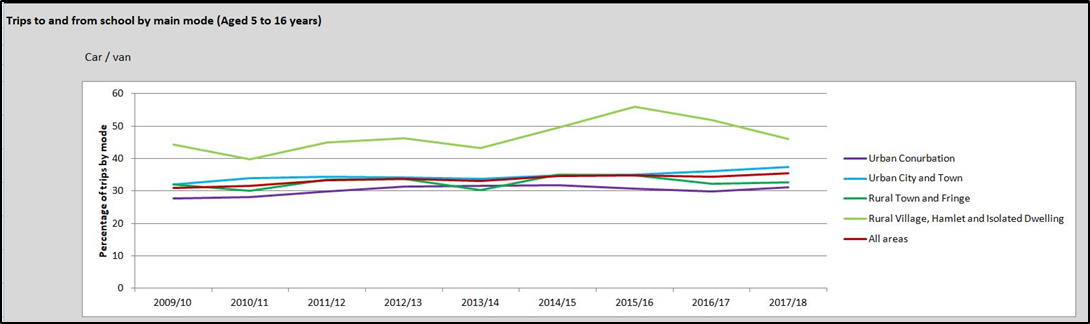
Travel to and from school highlights the same issues faced by rural households in accessing a great number of essential services. Households in the most rural areas of England make more trips to and from school by car than households in less rural areas, and more trips by this mode of transport than any other mode. For 11-16 year olds going to and from school, the average trip length is over 7miles, which is more than double that for children from urban households. There is a real cost burden of vehicle ownership on households in the most rural locations, and it is a cost that not all households can afford with few if any alternatives.
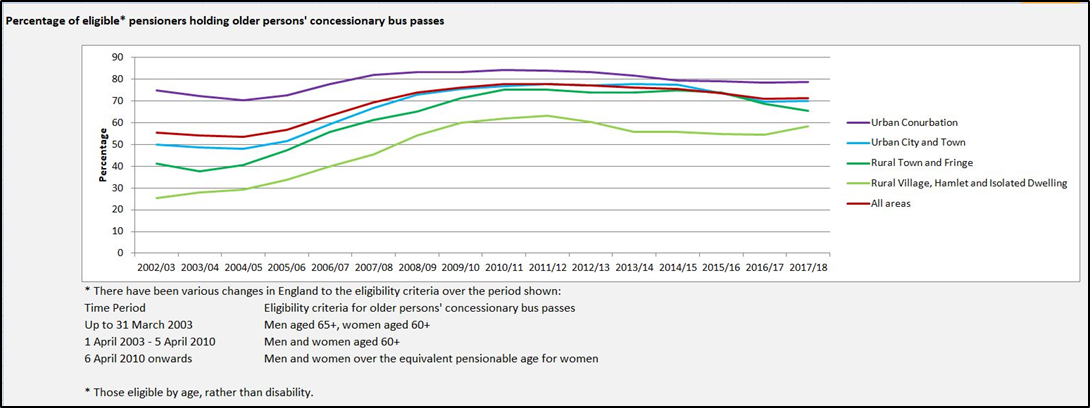
Older persons' concessionary bus passes
A final example of how households in the most rural areas of England have a real necessity of vehicle ownership comes by way of the take up of older persons' concessionary bus passes. The proportion of eligible pensioners holding such a pass is consistently lower for households in rural villages, hamlets and isolated dwellings. Where no convenient bus route exists there is little point in holding a concessionary bus pass, even when free to have.