T: 01822 851370 E: [email protected]
Visit RSN Survey about life in rural England to find out more.
Spotlight on the RSN Observatory

The RSN's Observatory is the place to discover the statistics behind key issues facing rural communities in England, issues that the RSN is striving to highlight and tackle through its work. The Observatory is additionally a great place to understand the numbers that define the communities within our membership through an expanding group of analyses, with this body of work soon to be given its own area on the RSN website called Member Insights.
Keep checking the 'What's New' section of the RSN's weekly Rural Bulletin to discover the latest RSN analyses and Observatory work.
In this edition of the 'Spotlight on the RSN Observatory', Dan Worth, our Research and Performance Analyst explores the latest fire statistics looking at incidents attended by fire and rescue services.
Introduction
The Home Office has responsibility for fire services in England, and collects and publishes information on incidents attended by the fire and rescue services. The calculation of rural and urban averages for this edition of the Spotlight uses the Rural Urban classifications of Fire and Rescue Services (FRS) as defined by the Department for Environment, Food and Rural Affairs. Per head rural and urban averages of incidents attended are provided here to focus on the issues where rural fire and rescue service providers are facing challenges over and above those seen by neighbouring urban fire and rescue services.
NB.
Predominantly rural: 50% or more of their area is 'rural'
Significantly rural: less than 74% of their area is 'urban' and 26% or more of their area is 'rural'
Predominantly urban: 74% or more of their area is 'urban'
2017 Mid-year population estimates were used in producing 2017/18 averages
2018 Mid-year population estimates were used in producing 2018/19 averages
Home Fire Safety Checks carried out by Fire and Rescue Services and partners
2017/18
Number of Fire Safety Checks carried out by Fire and Rescue Services (per 1,000 head of population)
Predominantly Rural - 8.58
Significant Rural - 10.32
Predominantly Urban - 10.91
On a per head of population basis, Fire and Rescue Services carry out 20% fewer safety checks in Predominantly Rural FRS service areas.
Number of Fire Safety Checks of Elderly (65+) carried out by Fire and Rescue Service (per 1,000 head of population)
Predominantly Rural - 4.57
Significant Rural - 6.74
Predominantly Urban - 5.30
On a per head of population basis, Fire and Rescue Services carry out 14% fewer safety checks of the elderly in Predominantly Rural FRS service areas than in Predominantly Urban. This is based on the 'per head of TOTAL population' figures. Predominantly Rural areas have a higher proportion of elderly residents and therefore the situation looking at these checks as a proportion of this specific age group would be worse than the above figures suggest.
Number of Fire Safety Checks of Disabled carried out by Fire and Rescue Service (per 1,000 head of population)
Predominantly Rural - 1.71
Significant Rural - 1.69
Predominantly Urban - 3.28
On a per head of population basis, Fire and Rescue Services carry out 48% fewer safety checks of disabled in Predominantly Rural FRS service areas.
Fatalities in non-fire incidents by non-fire incident type (main categories)
All values are based on a per 1,000 population basis for the rural urban FRS areas covered
2017/18
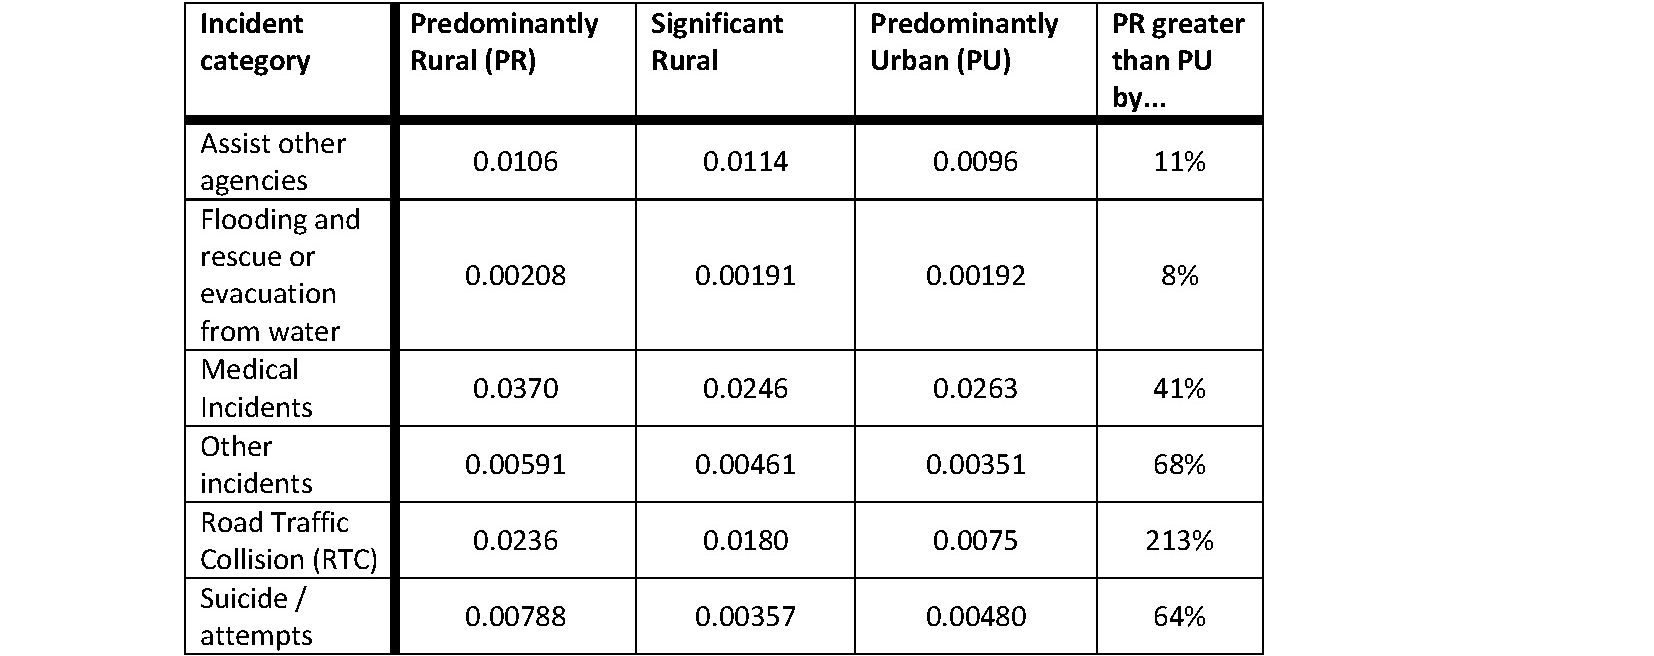
Fatalities as a result of non-fire incidents show that there are a few incident types that have higher rates based on population in rural FRS areas than in urban. Some are significantly higher such as Road Traffic Collisions, which on considering the nature of the roads and the average road speeds in rural areas, there are some immediately recognisable reasons why a difference exists. Other incident types where the proportion is higher for rural FRS areas, such as suicide / attempts, are less easy to comprehend and possibly highlight an otherwise hidden issue within our rural communities.
Non-fatal casualties in non-fire incidents by main category type (ALL categorised severity of injury)
All values are based on a per 1,000 population basis for the rural urban FRS areas covered
2017/18
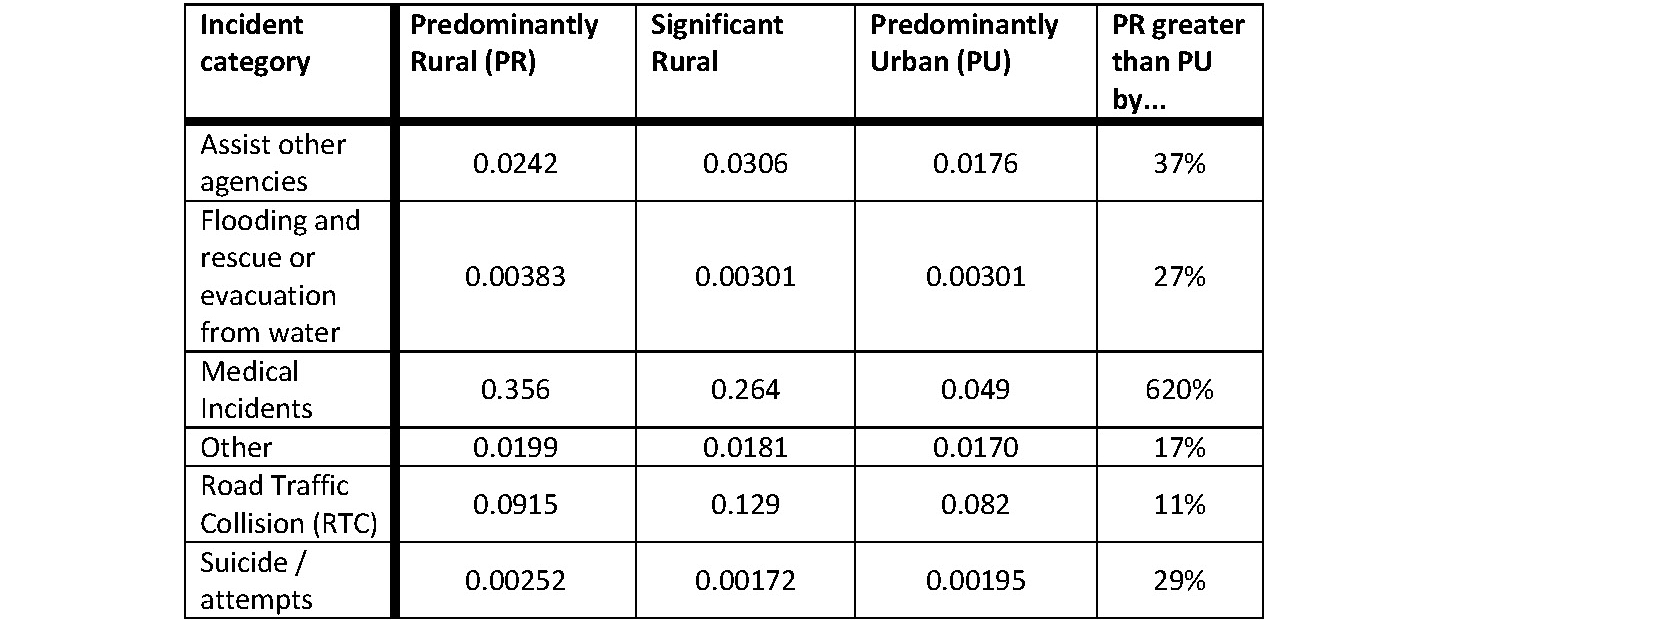
Injury severities are defined as:
Hospital severe – at least an overnight stay in hospital as an in-patient
Hospital slight – attending hospital as an outpatient (not precautionary check)
First aid – first aid given at scene (by anyone), including after a precautionary check
Precautionary checks – a precautionary check (to attend hospital or see a doctor) was recommended (by anyone)
Non-fatal casualties follow a similar pattern to fatalities for incident categories that are on a per capita basis more prevalent in rural FRS areas. A difference of note however is that of ‘medical incidents’ when comparing predominantly rural and predominantly urban fire and rescue service areas, where for non-fatal casualties the difference is 620% greater in rural, where as it is much lower at 41% for fatalities in non-fire incidents. This may indicate that fire and rescue services are being used quite differently between urban and rural areas for this incident category. Also worthy of mention is the difference for fatalities and non-fatal casualties for Road Traffic Collisions, where the PR / PU difference is 213% for fatalities yet just 11% for non-fatal casualties. Again the nature of the roads and travel in rural areas where average speeds are higher provide the obvious explanation that where speeds are greater, the consequences of collisions are more catastrophic.
Average response times
2017/18
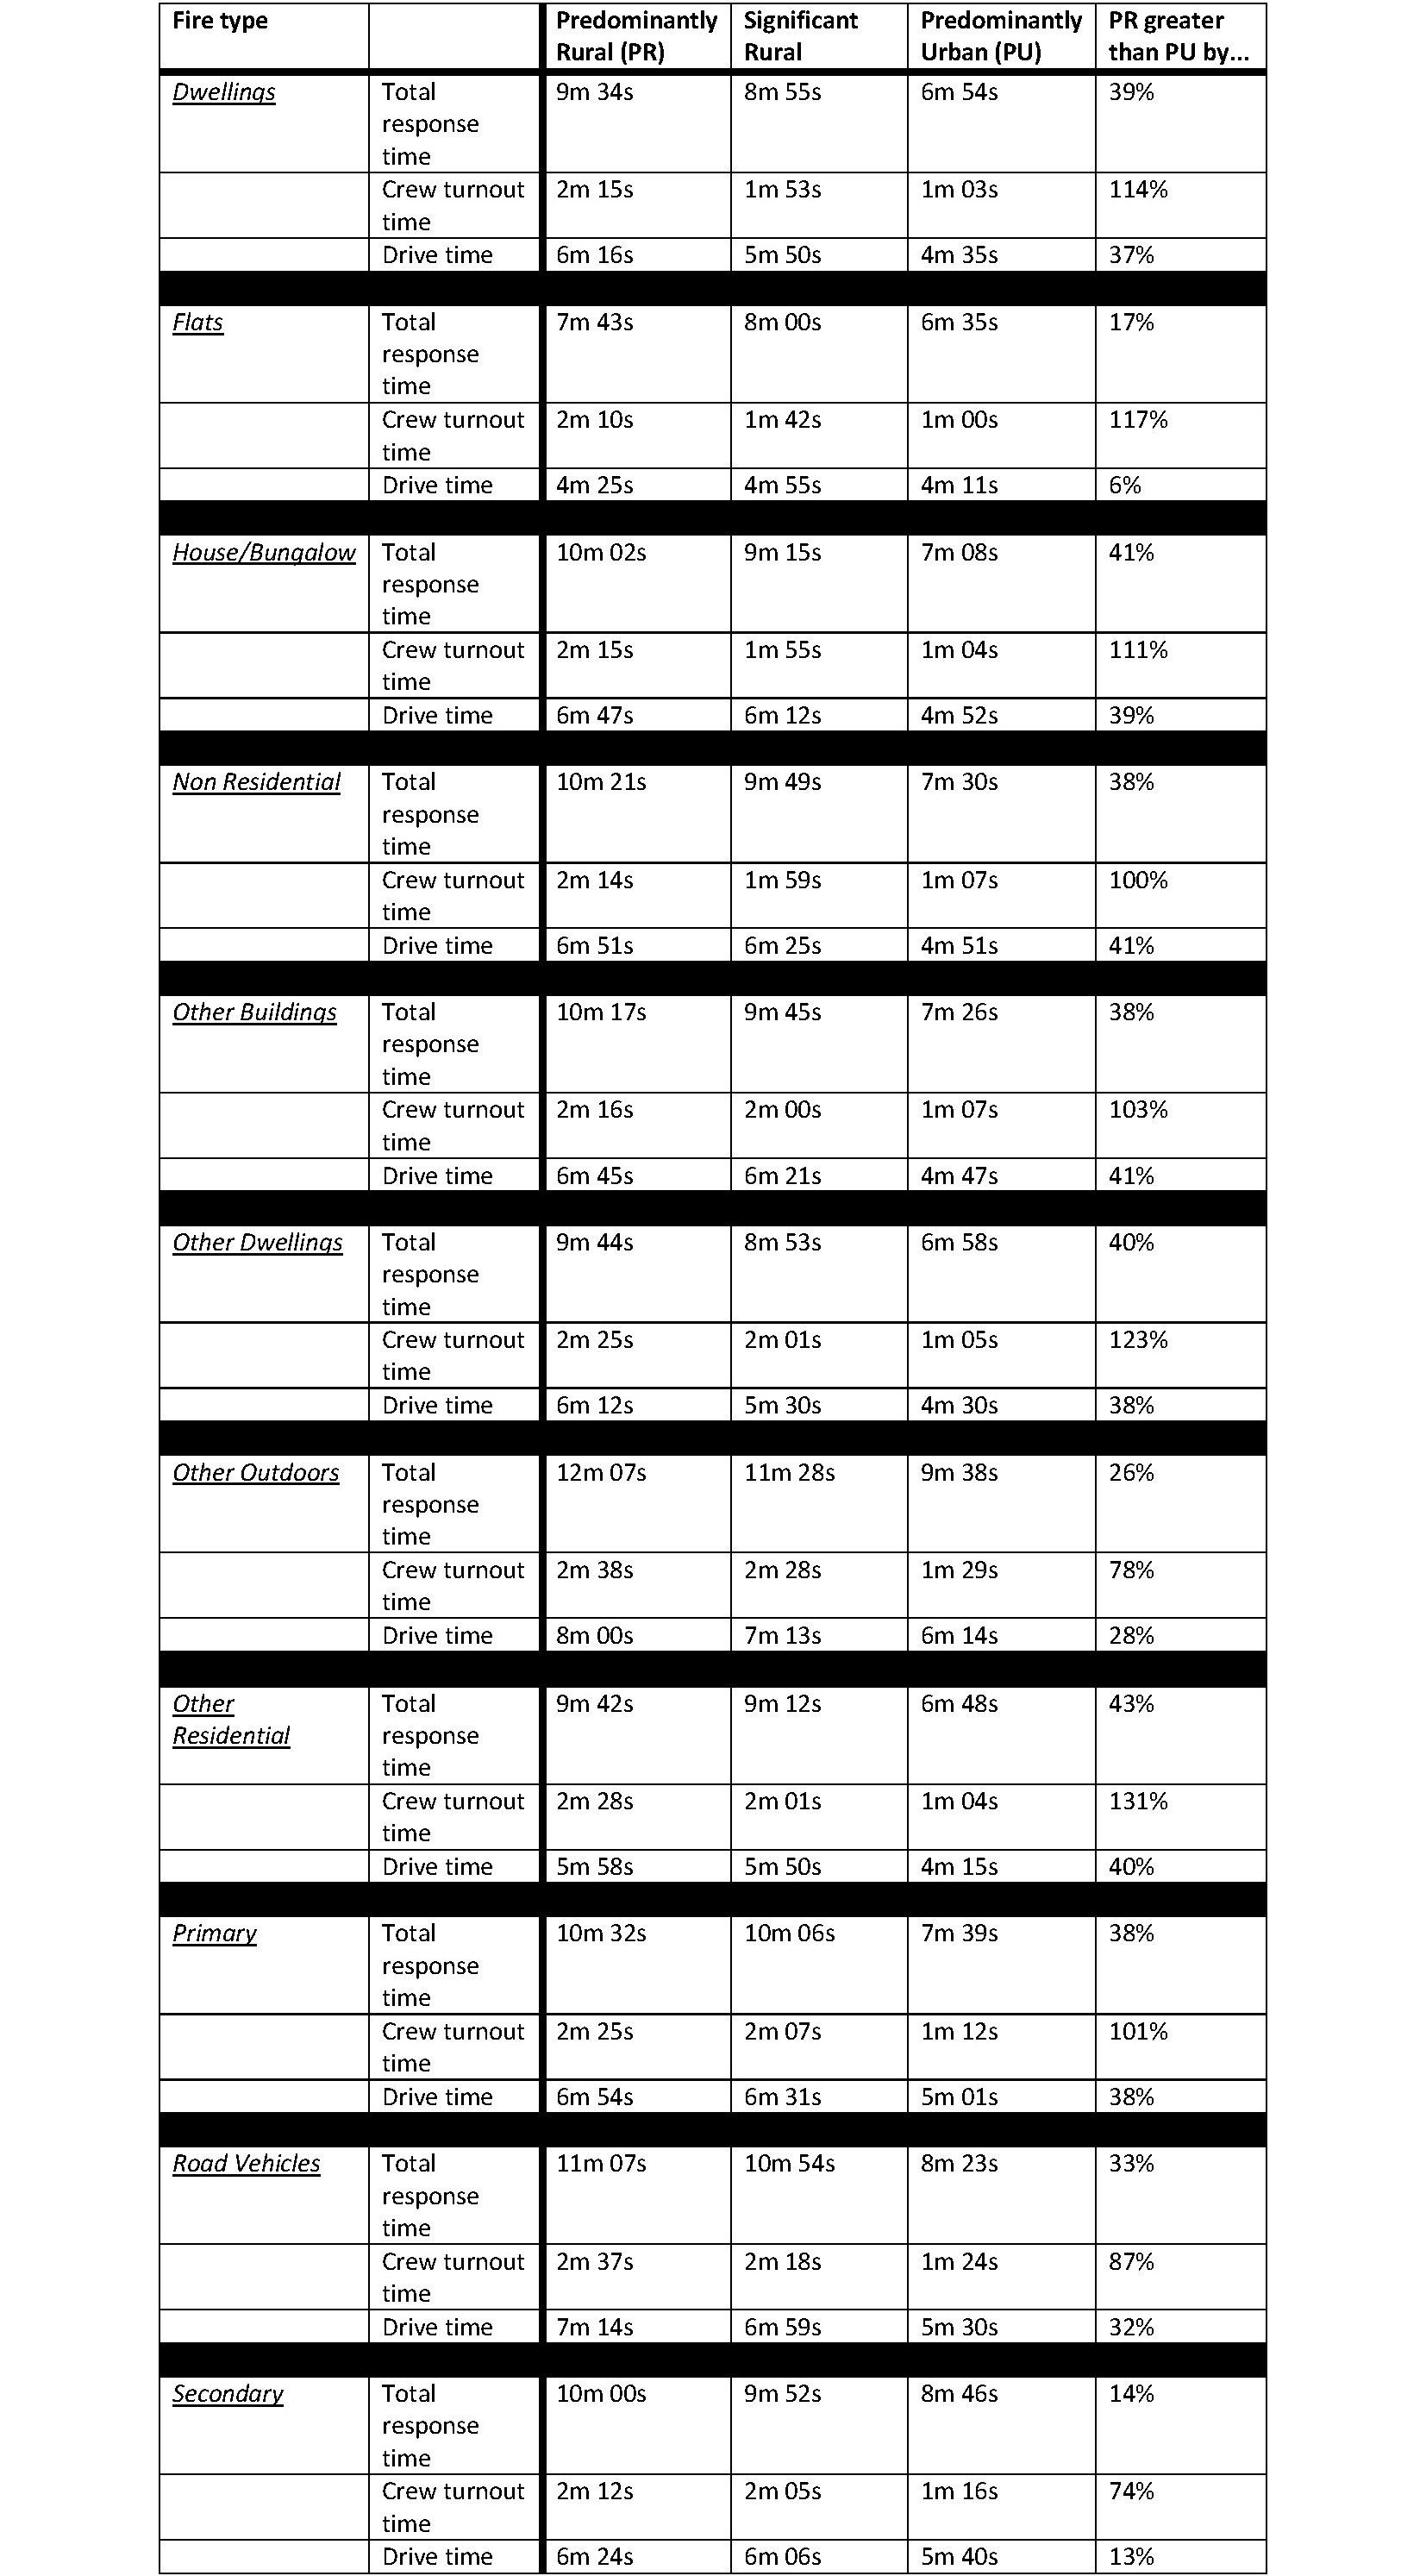
There is not a single fire type where the response time is not greater for Predominantly Rural fire and rescue services than for Predominantly Urban. There is naturally a human and economic cost to any disparity in response time that brings into focus the importance of an equitable fire and rescue service across the country.
- Primary fires are those where one or more of the following apply: i) all fires in buildings, outdoor structures and vehicles that are not derelict, ii) any fires involving casualties or rescues, iii) any fire attended by five or more appliances
- The largest components of 'other buildings fires' are incidents in private garden sheds, retail and food/drink buildings
- 'Other outdoor fires' are either fires in primary outdoor locations (eg. aircraft, boats, etc.) or fires in non-primary outdoor locations that have casualties or five or more pumping appliances in attendance.
- 'Secondary fires' are generally small outdoor fires, not involving people or property.
Non-fatal casualties by incident type
2018/19
Other Outdoors
Predominantly Rural - 0.00848 (39% greater than PU)
Significant Rural - 0.00807
Predominantly Urban (PU - 0.00608
Road Vehicles
Predominantly Rural - 0.01011 (36% greater than PU)
Significant Rural - 0.00892
Predominantly Urban (PU) - 0.00743
When looking at all incidents attended by fire and rescue services, the location groups that in 2018/19 resulted in more non-fatal casualties on a per capita basis for predominantly rural FRS areas were 'other outdoors' and 'road vehicles'. These are both logical outcomes of the relative rural nature of the geography and road networks.
Deliberate fires attended by fire and rescue services by incident type
2018/19
Other Outdoors
Predominantly Rural - 0.0618 (41% greater than PU)
Significant Rural - 0.0576
Predominantly Urban (PU) - 0.0439
When looking at deliberate primary fires attended by fire and rescue services, in 2018/19 'other outdoors' incident type showed a greater number per capita for predominantly rural FRS areas than predominantly urban. This again is a logical progression due to the rural nature of rural FRS areas.
Primary fires are defined as fires that meet at least one of the following conditions:
- any fire that occurred in a (non-derelict) building, vehicle or outdoor structure
- any fire involving fatalities, casualties or rescues
- any fire attended by five or more pumping appliances.
Incidents attended by fire and rescue services in England, by incident type
2018/19
Chimney Fires
Predominantly Rural - 0.138 (466% greater than PU)
Significant Rural - 0.080
Predominantly Urban (PU) - 0.024
Non-fire incidents (otherwise known as Special Service Incidents)
Predominantly Rural - 2.88 (10% greater than PU)
Significant Rural - 2.98
Predominantly Urban (PU) - 2.62
Other Buildings - Primary Fires
Predominantly Rural - 0.297 (12% greater than PU)
Significant Rural - 0.257
Predominantly Urban (PU) - 0.265
Other Outdoors - Primary fires
Predominantly Rural - 0.163 (70% greater than PU)
Significant Rural - 0.141
Predominantly Urban (PU) - 0.096
Road Vehicles - Primary fires
Predominantly Rural - 0.413 (6% greater than PU)
Significant Rural - 0.386
Predominantly Urban (PU) - 0.388
Chimney Fires and Other Outdoor Primary Fires show the greatest disparity in the situation looking at FRS attendance in Predominantly Rural and Predominantly Urban FRS areas. Both have a significantly higher per capita rate in Predominantly Rural areas (466% and 70% respectively compared to Predominantly Urban). These again are logical progressions from the nature of rural areas where a greater proportion of housing stock relies on solid fuels for heating and there are more outside buildings used to store agricultural or garden equipment and goods.
Primary fires are defined as fires that meet at least one of the following conditions:
- any fire that occurred in a (non-derelict) building, vehicle or outdoor structure
- any fire involving fatalities, casualties or rescues
- any fire attended by five or more pumping appliances.
Funding Fire and Rescue Services
Taking the core spending power figures from the final local government finance settlement 2019 to 2020 for combined fire and rescue authorities and the metropolitan fire and rescue authorities (excluding the Greater London Authority), average per capita Government funding levels were calculated for Predominantly Rural, Significant Rural and Predominantly Urban fire and rescue service areas. Taking these levels as an indicator of the relative level of funding over all fire and rescue services, Predominantly Rural residents receive approximately a quarter less funding per head for their fire and rescue services than Predominantly Urban residents.
Government Funded Spending Power (per head)
Predominantly Rural - £12.58 (26% less than PU)
Significant Rural - £12.48
Predominantly Urban (PU) - £16.90
Conclusion
It is clear that rural fire and rescue authorities have significant pressures both in the critical nature of the work undertaken, but also due to the rural environment in which the communities they serve exist. As has been seen, some of these pressures are more acute for rural areas when compared to urban FRS areas, but for a service in which response times are crucial to providing an equitable level of service that all communities can be confident in, funding must allow an equitable service to be delivered. The critical nature of the work, the importance of minimal response times, and the desire for a service level that is consistent for everyone in England no matter the location must deliver more money for rural fire and rescue services. It is apparent in taking a cross section of fire and rescue services in England (the selection being based on appropriate data being available as described above), that Government funding for fire and rescue services on a per capita basis favours urban areas. We at the Rural Services Network are committed to raising awareness of any disparity in the level of funding for services provided in rural areas of England.
Sources
Home Office - Fire statistics data tables
Office for National Statistics - Mid-year estimates of population
Ministry of Housing, Communities & Local Government - final local government finance settlement 2019 to 2020


